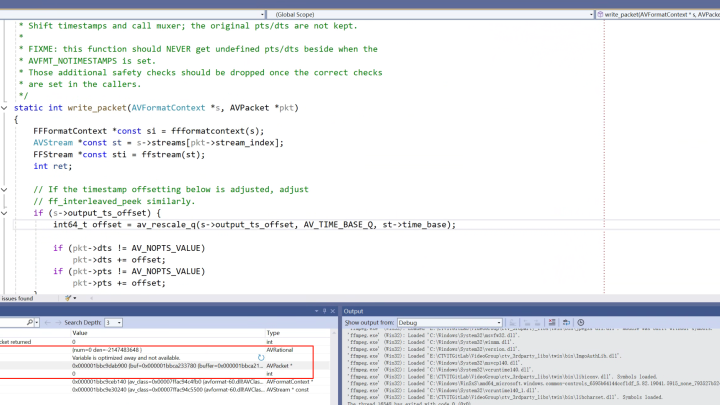
The complete error message looks like this:
Output in the debug console:
QtTest.exe (15068): Loaded 'D:\Qt\6.8.3\msvc2022_64\plugins\styles\qmodernwindowsstyled.dll'. Symbols loaded.
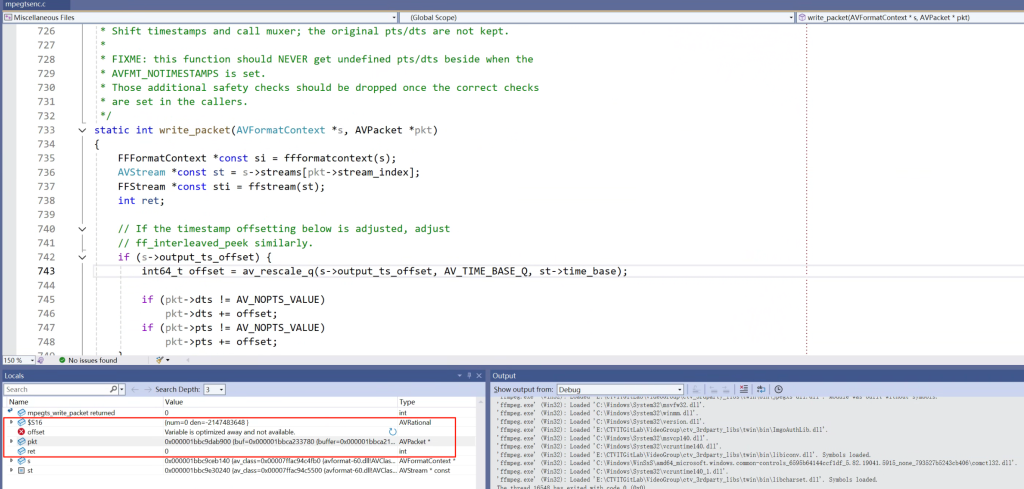
Cannot mix incompatible Qt library (6.8.3) with this library (6.8.0)
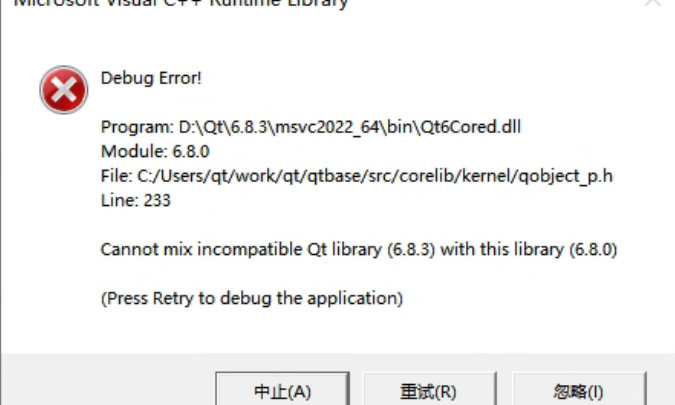
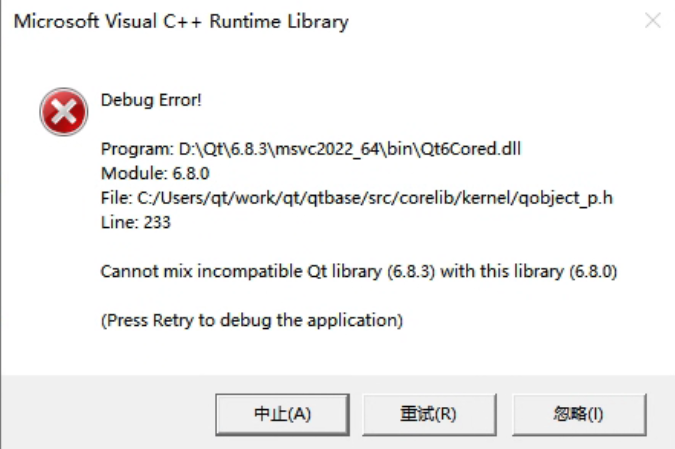
Debug Error!
Program: D:\Qt\6.8.3\msvc2022_64\bin\Qt6Cored.dll
Module: 6.8.0
File: C:/Users/qt/work/qt/qtbase/src/corelib/kernel/qobject_p.h
Line: 233
Cannot mix incompatible Qt library (6.8.3) with this library (6.8.0)
(Press Retry to debug the application)
This error occurred in a simple test program using QOpenGLWidget. The message clearly indicates that different versions of Qt libraries were mixed. Searching online shows many similar cases, usually caused by overlapping Qt DLL versions in the system PATH, because Qt loads many dynamic libraries as plugins. But after checking repeatedly, I confirmed that my environment did not have this issue. I only had one Qt installation, the prebuilt 6.8.3 version installed via Qt Maintenance Tool under D:\Qt\6.8.3. If I ignored the error, the program still ran correctly, but the popup was annoying, so I needed to investigate.
Continue reading…